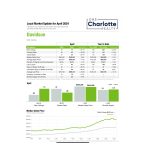
Davidson NC real estate market update April 2024
May 29, 2024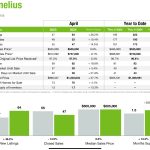
Cornelius, NC Real Estate Market Report Update for April 2024
June 3, 2024Charlotte, NC Housing Sales Update
Real Estate Housing Market Analysis for Charlotte, NC
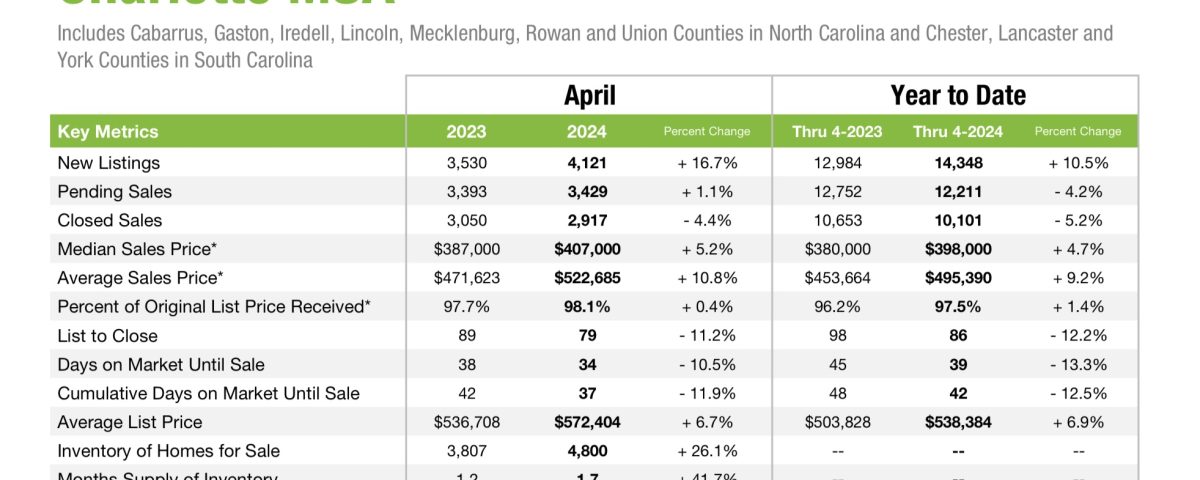
The Charlotte Real Estate market in April 2024 compared April 2023 is currently characterized by an increase in both the number of new listings and inventory, suggesting that more homeowners are looking to sell their Charlotte Homes, Charlotte Condos or Charlotte Townhomes. However, the decrease in closed sales points to possible challenges in closing deals, which could be due to various factors including financing issues or buyer hesitation.
Prices continue to rise, both in terms of median and average sales prices, indicating sustained demand and a competitive market. The decrease in days on market signifies that homes are selling quicker, further underscoring the demand.
The increase in the months supply of inventory, although still indicative of a seller’s market, suggests a trend towards a more balanced market. Buyers may find slightly more leverage than in previous months as inventory levels rise.
Conclusion
The Charlotte real estate market in April 2024 shows signs of growth and stability with increasing property values and quicker sales. However, the dip in closed sales could signal underlying issues that might need addressing to maintain market health. Overall, the market remains robust with positive trends for both buyers and sellers as we move further into the year.
For more detailed analysis and personalized insights, it’s recommended to consult with a local Realtor® who can provide expertise tailored to your specific needs.
The Charlotte Metropolitan Statistical Area (MSA) real estate market continues to show dynamic changes as we progress through 2024. The latest data from the Canopy Realtor® Association reveals significant shifts in various key metrics compared to the previous year. Here’s a detailed look at the market trends for April 2024.
Key Metrics Overview
New Listings:
- April 2023: 3,530
- April 2024: 4,121
- Year-over-Year Change: +16.7% The number of new listings saw a substantial increase of 16.7% compared to April 2023, indicating a growing interest among homeowners to sell their properties.
Pending Sales:
- April 2023: 3,393
- April 2024: 3,429
- Year-over-Year Change: +1.1% Pending sales experienced a modest increase of 1.1%, suggesting stable demand in the market.
Closed Sales:
- April 2023: 3,050
- April 2024: 2,917
- Year-over-Year Change: -4.4% Despite the rise in new listings and pending sales, closed sales dropped by 4.4%, indicating potential delays or challenges in finalizing transactions.
Median Sales Price:
- April 2023: $387,000
- April 2024: $407,000
- Year-over-Year Change: +5.2% The median sales price increased by 5.2%, reflecting a robust appreciation in home values.
Average Sales Price:
- April 2023: $471,623
- April 2024: $522,685
- Year-over-Year Change: +10.8% The average sales price showed an even more significant rise of 10.8%, underscoring the growing value of properties in the Charlotte MSA.
Percent of Original List Price Received:
- April 2023: 97.7%
- April 2024: 98.1%
- Year-over-Year Change: +0.4% Sellers are receiving a higher percentage of their original asking prices, which is a positive indicator of a competitive market.
Days on Market Until Sale:
- April 2023: 38 days
- April 2024: 34 days
- Year-over-Year Change: -10.5% Homes are selling faster, with the average days on market decreasing by 10.5%.
Inventory of Homes for Sale:
- April 2023: 3,807
- April 2024: 4,800
- Year-over-Year Change: +26.1% The inventory of homes for sale increased significantly by 26.1%, providing more options for buyers.
Months Supply of Inventory:
- April 2023: 1.2 months
- April 2024: 1.7 months
- Year-over-Year Change: +41.7% The months supply of inventory rose by 41.7%, indicating a shift towards a more balanced market.
Year-to-Date Performance (Thru April)
- New Listings: Up by 10.5% from 12,984 to 14,348.
- Pending Sales: Slightly down by 4.2% from 12,752 to 12,211.
- Closed Sales: Decreased by 5.2% from 10,653 to 10,101.
- Median Sales Price: Increased by 4.7% from $380,000 to $398,000.
- Average Sales Price: Increased by 6.9% from $503,828 to $538,384.
- Percent of Original List Price Received: Slight decrease by 0.2% from 97.5% to 97.3%.
- Days on Market Until Sale: Decreased by 13.3% from 45 days to 39 days.
- Cumulative Days on Market Until Sale: Decreased by 12.5% from 48 days to 42 days.


