Mooresville Real Estate Market Update April 2024
June 3, 2024
Charlotte Real Estate Soars: Named Top 10 Hottest Housing Market of 2024!
June 4, 2024Hunterville, NC Real Estate trends
The Huntersville real estate market has shown dynamic shifts from April 2023 to April 2024. These changes are shaping the local Huntersville housing landscape, influencing both buyers and sellers. Let’s dive into the detailed metrics and trends that define the Huntersville real estate market.
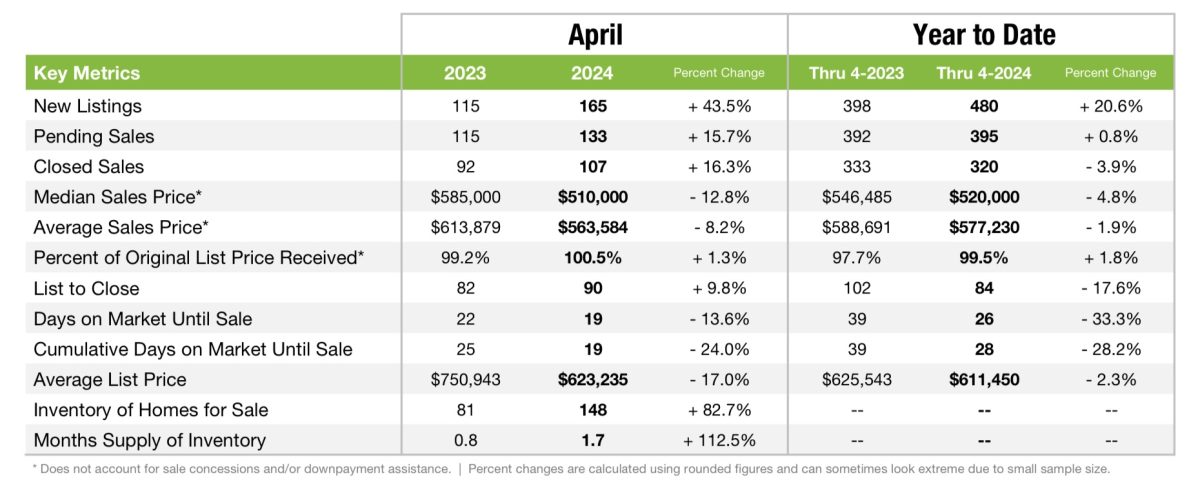
Huntersville Real Estate Key Metrics for April 2024
- New Listings in Huntersville: The number of new listings surged by 43.5%, from 115 in April 2023 to 165 in April 2024. This significant increase provides more options for potential buyers and indicates a healthy supply of homes entering the market.
- Pending Sales in Huntersville: Pending sales also saw a robust growth of 15.7%, with 133 homes under contract compared to 115 last year. This rise demonstrates strong buyer interest and sustained demand in the Huntersville real estate market.
- Closed Sales in Huntersville: Closed sales increased by 16.3%, with 107 homes sold in April 2024 compared to 92 in April 2023. This uptick indicates a healthy turnover of properties and successful transaction completions.
- Median Sales Price in Huntersville: The median sales price dropped by 12.8%, from $585,000 to $510,000. This decline could reflect a shift towards more affordable homes being sold compared to higher-end properties last year.
- Average Sales Price in Huntersville: The average sales price decreased by 8.2%, from $613,879 to $563,584. This reduction suggests a trend towards lower-priced home sales, potentially increasing market accessibility.
- Percent of Original List Price Received in Huntersville: Sellers received 100.5% of their original listing price on average, up from 99.2% in April 2023. This increase indicates a competitive market where homes often sell above asking prices.
- List to Close Ratio in Huntersville: The time from listing to closing extended by 9.8%, taking 90 days on average compared to 82 days last year. This longer period might be due to more complex transactions or slower processing times.
- Days on Market Until Sale in Huntersville: Homes stayed on the market for an average of 19 days, a decrease of 13.6% from 22 days in April 2023. This shorter market time suggests quick sales and high buyer interest.
- Cumulative Days on Market Until Sale in Huntersville: The cumulative days on market saw a significant drop of 24.0%, from 25 days to 19 days. This reduction indicates that homes are selling faster overall.
- Average List Price in Huntersville: The average list price decreased by 17.0%, from $750,943 to $623,235. This decline may reflect more competitively priced homes entering the market.
- Inventory of Homes for Sale in Huntersville: The inventory of homes for sale skyrocketed by 82.7%, with 148 homes available compared to 81 last April. This substantial increase enhances market supply and provides more choices for buyers.
- Months Supply of Inventory in Huntersville: The months supply of inventory more than doubled, increasing by 112.5% from 0.8 months to 1.7 months. This metric suggests a shift towards a more balanced market, though it still leans slightly in favor of sellers.
Huntersville Real Estate Year-to-Date Trends (Through April 2024)
- New Listings in Huntersville: Up by 20.6%, with 480 new listings compared to 398 last year.
- Pending Sales in Huntersville: Increased by 0.8%, reaching 395 compared to 392.
- Closed Sales in Huntersville: Decreased by 3.9%, with 320 closed sales versus 333 last year.
- Median Sales Price in Huntersville: Dropped by 4.8%, from $546,485 to $520,000.
- Average Sales Price in Huntersville: Down by 1.9%, from $588,691 to $577,230.
- Percent of Original List Price Received in Huntersville: Increased by 1.8%, at 99.5% compared to 97.7%.
- List to Close in Huntersville : Decreased by 17.6%, taking 84 days compared to 102 days.
- Days on Market Until Sale in Huntersville : Decreased by 33.3%, with 26 days compared to 39 days.
- Cumulative Days on Market Until Sale in Huntersville: Decreased by 28.2%, from 39 days to 28 days.
- Average List Price in Huntersville: Decreased by 2.3%, from $625,543 to $611,450.
Conclusion for the Huntersville Real Estate Market
The Huntersville real estate market in April 2024 exhibits a dynamic environment with substantial increases in new listings, pending sales, and closed sales. However, there is a noticeable decline in both median and average sales prices, reflecting a shift towards more affordable homes. The significant increase in inventory and months supply of inventory indicates a move towards a more balanced market, offering more options for buyers while still favoring sellers to some extent. These trends are critical for buyers, sellers, and investors as they navigate the Huntersville real estate market.
For those looking to buy or sell in Huntersville, understanding these market dynamics is essential to make informed decisions and capitalize on current opportunities. Stay updated with the latest trends and leverage this information to achieve your real estate goals in Huntersville.
Call a Huntersville Real Estate Agent at 704-670-0000 to List your Home For Sale
20 Newest Real Estate listings in Huntersville, NC below


